Usage
To us the financial_analyzer package in a project you can import it and make sure you have the most recent version as per our latest releases.
import financial_analyzer

print(financial_analyzer.__version__)
0.2.4
Example usage
Here we will demonstrate how to make use of the financial_analyzer package, a package produced to help users solve everyday financial problems related to their returns, accounting, and profits. This package contains four major functions, the breakeven_point() function for calculating ones business or service break even point, a roi() function for producing ones return on investment, a units_for_target_profit() for calculating how many units of your product you must sell to produced a desired profiit, and lastly a plot_breakeven_point() for graphing and visualizing the break even point, along with the revenue and cost lines. This package has the expectation to help business owners, enthusiasts of finance, and individuals preparing and completing interview questions.
Import
from financial_analyzer.breakeven_point import breakeven_point
from financial_analyzer.roi import roi
from financial_analyzer.units_for_target_profit import units_for_target_profit
from financial_analyzer.plot_breakeven_point import plot_breakeven_point
import pandas as pd
Breakeven point calculation
Here we will first perform break even calculation, using the breakeven_point() function. This function takes in three values as inputs, they are fixed_cost which represents the fixed costs of your business or service, sales_price_per_unit which represents the sales price of each one unit of your product, and variable_cost_per_unit which represents the variable cost incurred by one more unit of your product sold. In the context of this function we will solve the example: You are an artists selling paintings, your fixed costs are 5,000 dollars per month, each painting is sold for 20 dollars, the variable cost (costs of materials for each painting) are 10 dollars- What is the break even point of your company, how many paintings must you sell to break even?
fixed_costs = 5000
sales_price_per_unit = 20
variable_cost_per_unit = 10

break_even_units = breakeven_point(
    fixed_costs,
    sales_price_per_unit,
    variable_cost_per_unit
)

print(f"The break even units is {break_even_units} units")
The break even units is 500.0 units
The output for the given function is 500, this means that we will need to 500 paintings in order to break even this month. This is an example of how you can make use of the breakeven_point() function to solve financial problems in python.
Return on investment calculation
Now we will calcuate the percentage return on investment (ROI,) which is current value minus the initial investment, then divided by initial investment, we hen multiple this by 100 to get the percentage. This function has a goal of determining how efficient an investment is, by quantifying the percent return of the investment relative to the initial cost of that investment. This function takes in two parameters as inputs initial_investment, which is the initial amount invested, and current_value, the present value of the investment.
To convey this functions use case, lets consider the following scenario: You are an artist who has invested a hefty amount of money into your business and you would like to understand how this investment has treated you thus far financially. Suppose you initially invested 1,000,000 dollars to setup your studio and pay for marketing of it along with pay for materials for your art. After one year of running your business your business is now worth 1,200,000 dollars (including all assets of sold and unsold paintings) - you are now interested in understanding the ROI of your business, what is the financial performance of your investment.
initial_investment = 1000000
current_value = 1200000

investment_return = roi(
    initial_investment,
    current_value
)

print(f"The ROI of your investment is {investment_return:.2f}%")
The ROI of your investment is 20.00%
The output produced by the roi() function is 20, this means that your business has produced you a 20% return on investment over the course of running your business for a year. This is an example and use case for the roi() function, and how it can be applied to a real world problem relating to investments and finances.
Target unit calculation
The following section will demonstrate how to make use of the units_for_target_profit() function, this is a practical function to help individuals calculate the exact number of units of their product they must sell to produce a specified profit. This function can be very useful for a business owner to forecast and plan their business operations. The function requires four parameters as inputs: fixed_costs, the total fixed costs of the business; sales_price_per_unit, the selling price per unit of the product or service; variable_cost_per_unit, the variable cost for each unit produced; and desired_profit, the target profit figure.
To provide real world context for the application of this function consider the following scenario: Imagine you are an artist aiming for a goal profit of 2,000 dollars this week. The fixed costs of your business including rent, utilities, and marketing are 3,000 dollars. You sell each art piece for 5 dollars where each variable cost for each painting (materials and canvas) is 2 dollars. You want to now know how many pieces of art you must sell to reach the profit goal of 2,000 dollars.
fixed_costs = 3000
sales_price_per_unit = 5
variable_cost_per_unit = 2
desired_profit = 2000

units_needed = units_for_target_profit(
    fixed_costs,
    sales_price_per_unit,
    variable_cost_per_unit,
    desired_profit
)

print(f"To achieve a profit of ${desired_profit}, you need to sell {units_needed} units.")
To achieve a profit of $2000, you need to sell 1667 units.
After implementing the function it produces an output of 1667. This means that you must sell 1667 pieces of art to achieve the desired profit goal of 2000 dollars this week. This is a practical example of how you can use the units_for_target_profit() function in a real world context or problem on a financial interview test.
Breakeven point visualization
The following section will explain how to make use of the plot_breakeven_point() function, this is a very useful tool for visualizing and representing a business’s financials, more specifically for a break-even analysis. The function produces a plot that illustrates the relationships between total cost, total revenue, and the number of units sold by a business - this can help visually represent when a business will start to make a profit given the revenue and cost values of their business. The plot represents three key lines: total revenue, total cost (which includes both variable and fixed costs), and the Fixed Cost line alone. The function takes four inputs: fixed_costs, representing the total fixed costs in a business scenario; sales_price_per_unit, the price at which each unit is sold; variable_cost_per_unit, the cost incurred for producing each unit; and max_units, which sets the maximum number of units to be plotted.
Lets consider the real world application for this function with the following scenario: Lets imagine you are running a Coffee Shop, you have fixed costs amount to 1,000 dollars (which represents rent, utilities, wages for staff, marketing). Each cup of coffee you sell, is sold for 5 dollars, and each cup of coffee has a variable cost of 2 dollars (cost of the paper cup, the coffee beans used, and water). You want to understand your business performance and financial dynamics visually and understand your break-even point with regards to your costs and revenue values - specifically for a week where you were to between 0 to 500 cups of coffee.
fixed_costs = 1000
sales_price_per_unit = 5
variable_cost_per_unit = 2
max_units = 500

# Generate the break-even plot
break_even_plot, plot_df = plot_breakeven_point(
    fixed_costs,
    sales_price_per_unit,
    variable_cost_per_unit,
    max_units
)
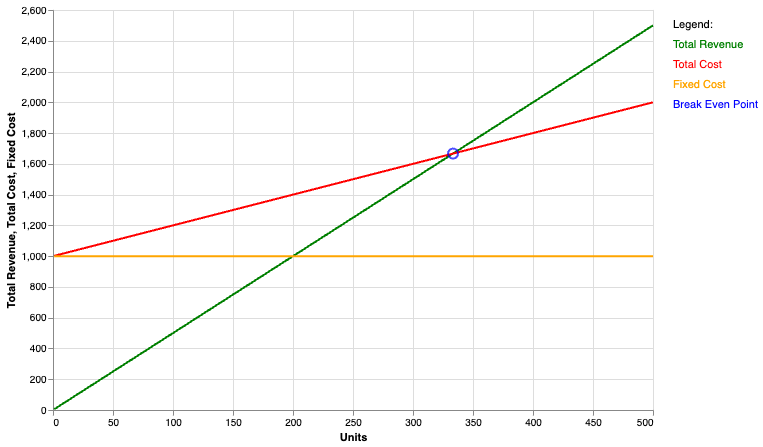
This function will produce two outputs, one which is a altair plot object representing the plot for the three lines representing your businesses financial performance and intersection between them. Secondly it produces a DataFrame that contains the calculations and data produced from the four input values in order to produce the four lines, and extrapolate the cost and revenue values across the max number of units sold in the context for the question, which is 500 in this case.
To show another example we can picture the situation where you are a small business owner the offers a roof cleaning service. You business has a fixed cost of 10,000 dollars from your insurance, certification, truck, and tool expenses. Your business charges 200 dollars for every roof that you clean, however there are variables costs coming from the materials used (roof shampoo) and the transport expenses (gas) which come out to about 35 dollars per roof. In a regular roof cleaning season (April to May) you have at most ever cleaned 200 roofs. You decide to make use of the plot_breakeven_point() function to get a visual understanding of you businesses costs and returns, you plug in the following values and produce the graph:
fixed_costs = 10000
sales_price_per_unit = 200
variable_cost_per_unit = 35
max_units = 200

# Generate the break-even plot
break_even_plot, plot_df = plot_breakeven_point(
    fixed_costs,
    sales_price_per_unit,
    variable_cost_per_unit,
    max_units
)
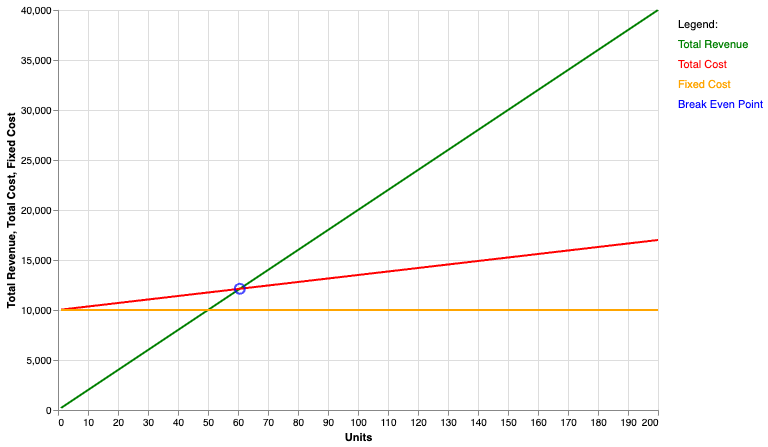
As you can see the plot is very helpful again for displaying the relationship between my different costs, as well as my revenue from selling my service. Looking at the plot I can see exactly where the break even point is, telling me I need to clean at least 60 houses before the end of the roof cleaning season to turn a profit. We can very clearly see where the total revenue is by units sold from the green line, as well as were our total costs sit as we increase out sales from the red line. These are just a few examples for both individuals running service and product based business, and how they can make use of our package to understand the cost and revenue landscape of their business.